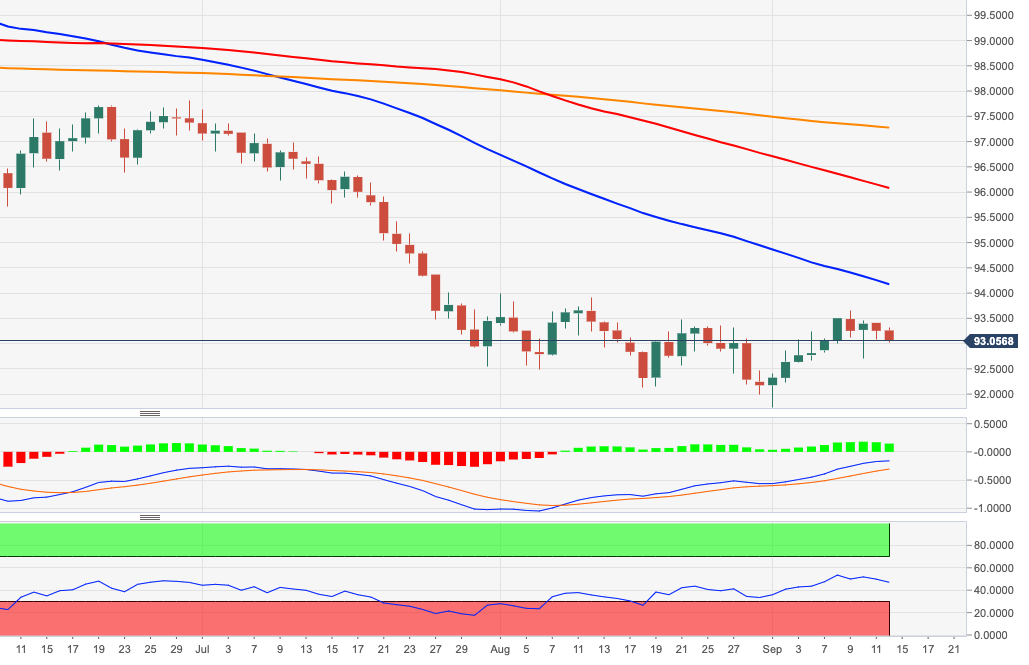
US Dollar Index Price Analysis: Corrective downside could test 92.70
by Pablo Piovano- DXY resumes the downside and challenges the 93.00 support.
- A breach of 93.00 should pave the way for a move to 92.70.
DXY is now adding to Friday’s losses near the 93.00 neighbourhood on the back of the continuation of the positive sentiment in the risk-associated space.
Further downside now seems likely and a drop below 93.00 should expose last week’s lows around 92.70 (September 11).
The offered stance in the dollar is expected to remain unchanged while below the 200-day SMA, today at 97.27.
DXY daily chart

Dollar Index Spot
| Overview | |
|---|---|
| Today last price | 93.07 |
| Today Daily Change | 30 |
| Today Daily Change % | -0.19 |
| Today daily open | 93.25 |
| Trends | |
|---|---|
| Daily SMA20 | 92.89 |
| Daily SMA50 | 93.95 |
| Daily SMA100 | 96.15 |
| Daily SMA200 | 97.3 |
| Levels | |
|---|---|
| Previous Daily High | 93.42 |
| Previous Daily Low | 93.09 |
| Previous Weekly High | 93.66 |
| Previous Weekly Low | 92.7 |
| Previous Monthly High | 94 |
| Previous Monthly Low | 92 |
| Daily Fibonacci 38.2% | 93.22 |
| Daily Fibonacci 61.8% | 93.29 |
| Daily Pivot Point S1 | 93.09 |
| Daily Pivot Point S2 | 92.92 |
| Daily Pivot Point S3 | 92.76 |
| Daily Pivot Point R1 | 93.42 |
| Daily Pivot Point R2 | 93.59 |
| Daily Pivot Point R3 | 93.75 |