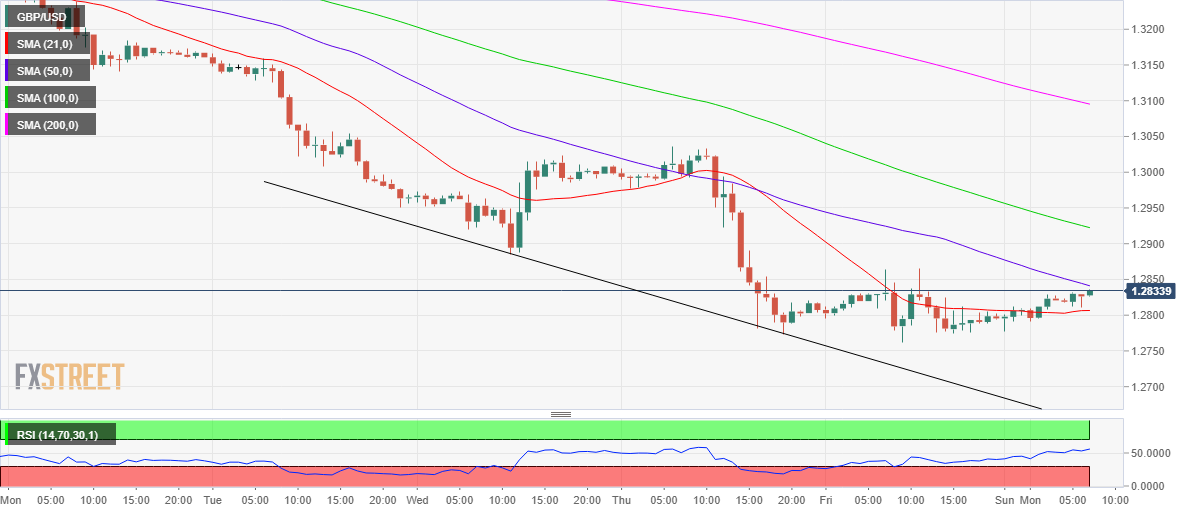
GBP/USD Price Analysis: Recapturing of 50-HMA critical for further recovery
by Dhwani Mehta- GBP/USD looks to extend the recovery above 1.2800.
- Immediate upside to be capped by 50-HMA at 1.2845.
- The cable awaits debate on Internal Market Bill for fresh impetus.
On its road to recovery from near seven-week lows this Monday, GBP/USD cut through the horizontal 21-Simple Moving Average on the hourly chart (HMA) at 1.2804.
A firm break above the latter opened doors for additional upside, although the price is likely to face stiff resistance at the downward-sloping 50-HMA of $1.2845.
Acceptance above the 50-HMA barrier is important in order to extend the recovery from multi-week troughs of 1.2763.
The hourly Relative Strength Index (RSI) turns flat despite holding above the midline, suggesting that the bulls could struggle to take on the upside.
Also, it's worth noting that the cable traders could turn cautious ahead of the critical parliamentary debate on the UK’s Internal Market Bill scheduled later today.
Further north, Friday’s high of 1.2866 could challenge the bulls’ commitment en route the test of the bearish 100-HMA at 1.2922.
To the downside, the 21-HMA resistance now support could limit the pullbacks. A break below which could prompt a sell-off towards the seven-week lows.
GBP/USD: Hourly chart

GBP/USD: Additional levels
GBP/USD
| Overview | |
|---|---|
| Today last price | 1.2830 |
| Today Daily Change | 0.0030 |
| Today Daily Change % | 0.23 |
| Today daily open | 1.2796 |
| Trends | |
|---|---|
| Daily SMA20 | 1.3157 |
| Daily SMA50 | 1.2965 |
| Daily SMA100 | 1.2694 |
| Daily SMA200 | 1.2737 |
| Levels | |
|---|---|
| Previous Daily High | 1.2866 |
| Previous Daily Low | 1.2763 |
| Previous Weekly High | 1.3279 |
| Previous Weekly Low | 1.2763 |
| Previous Monthly High | 1.3396 |
| Previous Monthly Low | 1.2982 |
| Daily Fibonacci 38.2% | 1.2802 |
| Daily Fibonacci 61.8% | 1.2826 |
| Daily Pivot Point S1 | 1.275 |
| Daily Pivot Point S2 | 1.2705 |
| Daily Pivot Point S3 | 1.2647 |
| Daily Pivot Point R1 | 1.2853 |
| Daily Pivot Point R2 | 1.2911 |
| Daily Pivot Point R3 | 1.2957 |