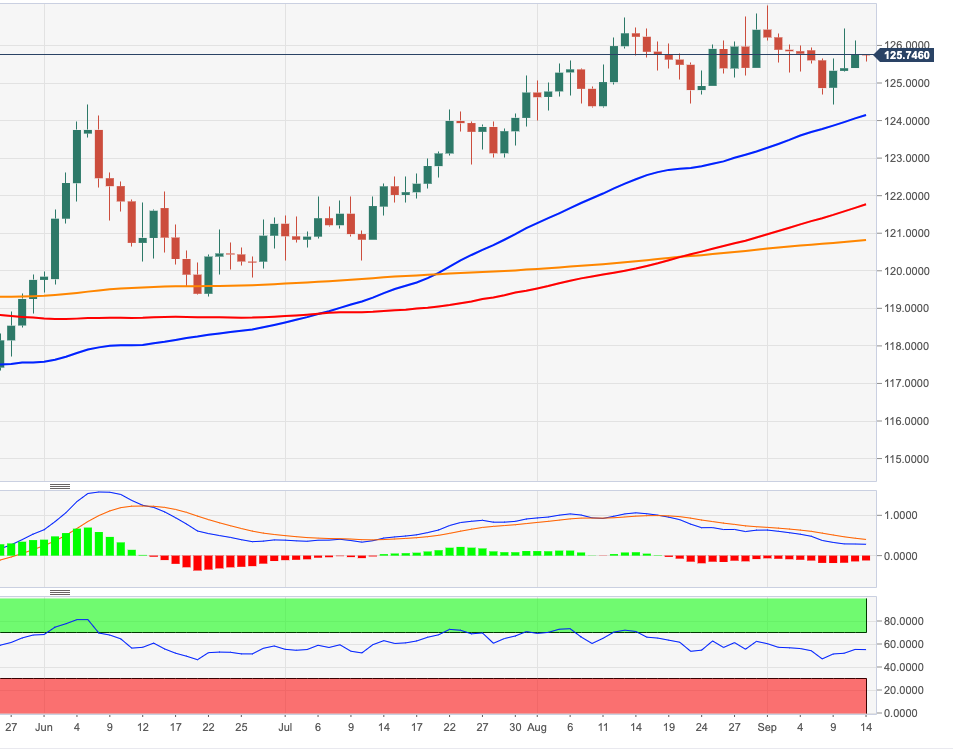
EUR/JPY Price Analysis: Interim hurdle emerges at 126.46
by Pablo Piovano- EUR/JPY trades within a narrow range in the 125.70 region on Monday.
- There is an interim resistance at the post-ECB high near 1256.50.
EUR/JPY is alternating gains with losses below the 126.00 mark at the beginning of the week.
Bulls need to surpass last week’s top near 126.50 (post-ECB meeting highs) to allow for another attempt to visit the 2020 highs just beyond 127.00 the figure recorded on September 1.
The constructive view around EUR/JPY is predicted to remain unchanged while above the 200-day SMA at 120.77.
EUR/JPY daily chart

EUR/JPY
| Overview | |
|---|---|
| Today last price | 125.72 |
| Today Daily Change | 24 |
| Today Daily Change % | -0.03 |
| Today daily open | 125.76 |
| Trends | |
|---|---|
| Daily SMA20 | 125.61 |
| Daily SMA50 | 124.37 |
| Daily SMA100 | 121.68 |
| Daily SMA200 | 120.79 |
| Levels | |
|---|---|
| Previous Daily High | 126.13 |
| Previous Daily Low | 125.39 |
| Previous Weekly High | 126.46 |
| Previous Weekly Low | 124.43 |
| Previous Monthly High | 126.85 |
| Previous Monthly Low | 123.99 |
| Daily Fibonacci 38.2% | 125.85 |
| Daily Fibonacci 61.8% | 125.67 |
| Daily Pivot Point S1 | 125.39 |
| Daily Pivot Point S2 | 125.03 |
| Daily Pivot Point S3 | 124.66 |
| Daily Pivot Point R1 | 126.13 |
| Daily Pivot Point R2 | 126.5 |
| Daily Pivot Point R3 | 126.86 |