EUR/GBP Price Analysis: Eases from six-month high amid overbought RSI
by Anil Panchal- EUR/GBP stays mildly offered as buyers await fresh clues to attack 0.9300.
- August 2019 peak adds to the upside barrier ahead of the yearly top.
- 0.9210, June month’s high can entertain short-term sellers.
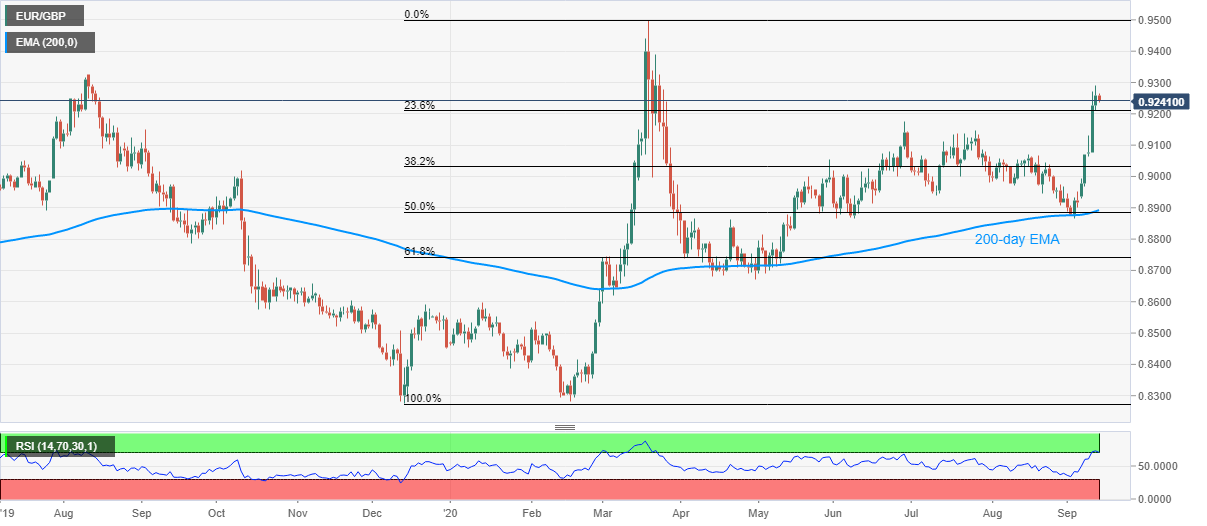
EUR/GBP declines to 0.9240, down 0.18% on a day, ahead of Monday’s European session. In doing so, the quote takes a U-turn from the highest since late-March amid overbought RSI conditions.
As a result, traders can witness a bit of more selling towards 23.6% Fibonacci retracement of December 2019 to March 2020 upside, around 0.9210, ahead of finding another strong support near 0.9175, including June’s peak.
If at all the bears manage to dominate past-0.9175, July’s top of 0.9148 and August month’s top near 0.9070 will flash on their radars.
Meanwhile, an upside clearance of 0.9300 becomes necessary for the bulls before they aim for August 2019 high surrounding 0.9325.
Also luring the bulls beyond 0.9300 will be the year’s high, marked in March, near 0.9500.
EUR/GBP daily chart

Trend: Pullback expected
Additional important levels
| Overview | |
|---|---|
| Today last price | 0.9244 |
| Today Daily Change | -0.0014 |
| Today Daily Change % | -0.15% |
| Today daily open | 0.9258 |
| Trends | |
|---|---|
| Daily SMA20 | 0.9005 |
| Daily SMA50 | 0.9026 |
| Daily SMA100 | 0.8972 |
| Daily SMA200 | 0.88 |
| Levels | |
|---|---|
| Previous Daily High | 0.9292 |
| Previous Daily Low | 0.921 |
| Previous Weekly High | 0.9292 |
| Previous Weekly Low | 0.8929 |
| Previous Monthly High | 0.907 |
| Previous Monthly Low | 0.8909 |
| Daily Fibonacci 38.2% | 0.9261 |
| Daily Fibonacci 61.8% | 0.9241 |
| Daily Pivot Point S1 | 0.9215 |
| Daily Pivot Point S2 | 0.9172 |
| Daily Pivot Point S3 | 0.9134 |
| Daily Pivot Point R1 | 0.9296 |
| Daily Pivot Point R2 | 0.9335 |
| Daily Pivot Point R3 | 0.9378 |